SVG Chart
Create SVG charts from a set of data and different options.
IMPORTANT: This is an ESM only package.
Installation
npm install @coderundebug/svg-chart
Introduction
This library gives you the tools you need to create different types of charts in SVG to be used in documents, PDFs, reports and other places. The outputted SVG text can be used in any way you require. If you want to use them on a web site then you may find the chart web components used in UI-WEB Chart library a better option. They interact with the user, are more responsive and they use similar data and options parameters.
You can find more information about each chart type, and interact with all the different settings available, by going to the svg-chart.netlify.app site.
Example
In this example we are creating a pie chart with 3 slices.
The outputted SVG text contains all the information about the pie chart.
The final result can be displayed on the page, in a document, or anywhere you need.
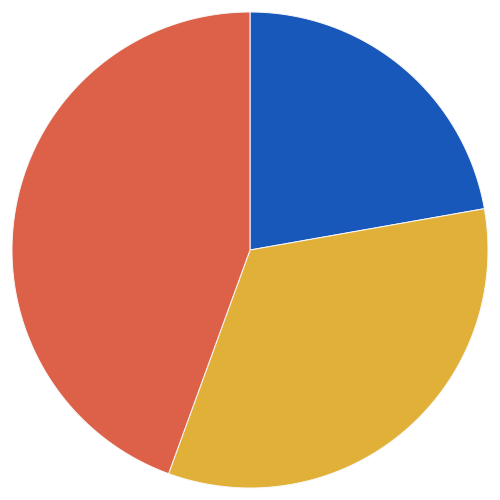
Chart Types
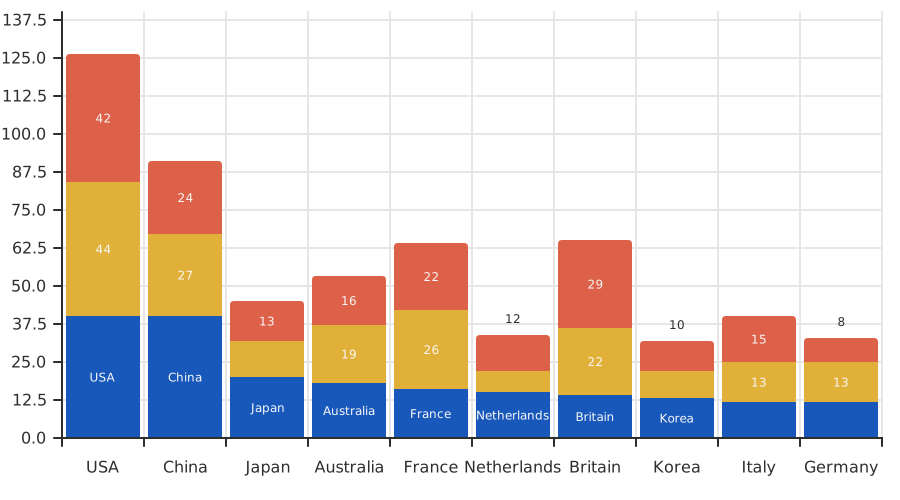
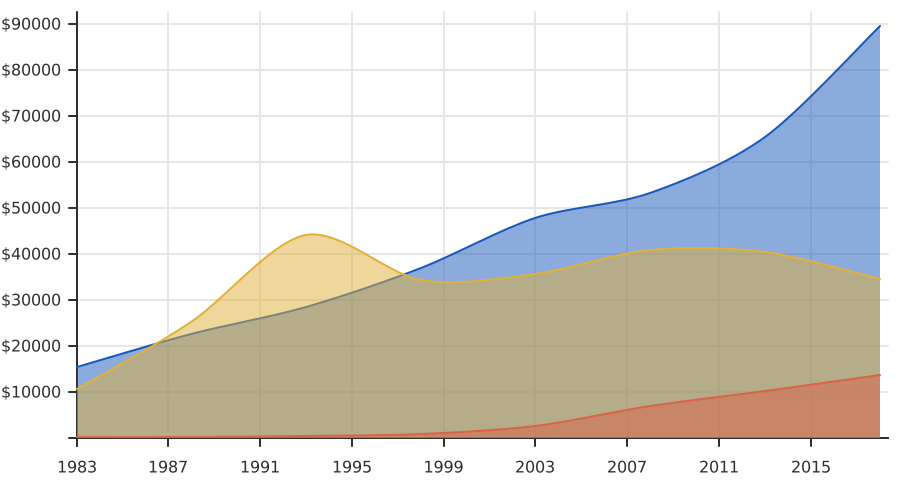
You can create Pie charts, Bar charts, Line charts and Day charts.